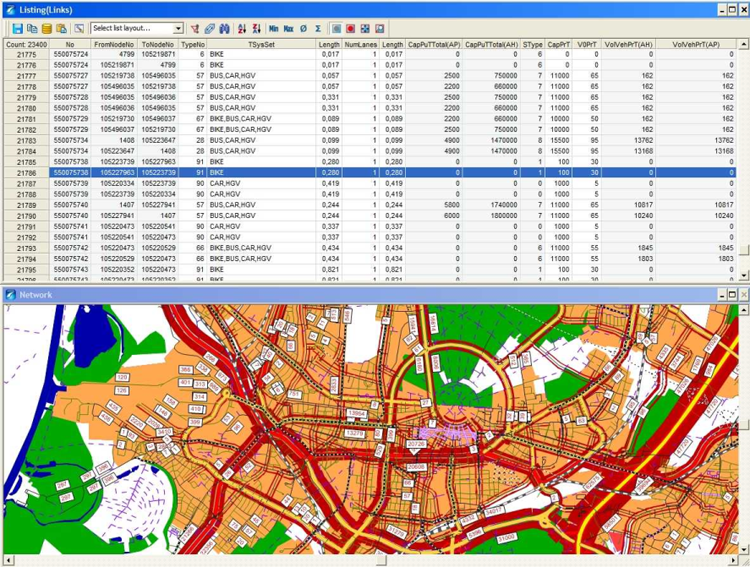
Visum provides a wide range of graphical and tabular display options for the data of your traffic model. You can analyze the model data from different views. You can e.g. show the link volumes calculated in an assignment procedure in table or a list, or graphically as link bars in the Network editor, as depicted in Illustration 243. Below, display types which are often used are introduced in examples. Primarily, these are there to give an idea on the diversity of the graphic display possibilities in Visum. You can find all setting possibilities for graphic parameters and lists in the detailed description (Using Visum: Displaying data graphically and in lists).

Illustration 243: Graphical and tabular display of link volumes

